WBGT Heat Mapping Project
Mapping Urban Heat with Citizen Science
This summer, the Southeast Regional Climate Center (SERCC) is launching an exciting citizen science initiative to better understand how heat impacts our local communities. Along with our dedicated volunteers, we are collecting high-resolution heat data across Chapel Hill, Carrboro, and South Durham. Our goal is to capture the fine-scale variations in heat exposure that residents experience on a daily basis, as well as during extreme heat events.
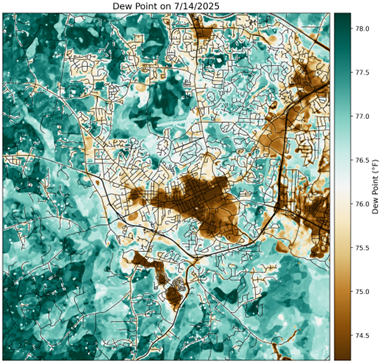
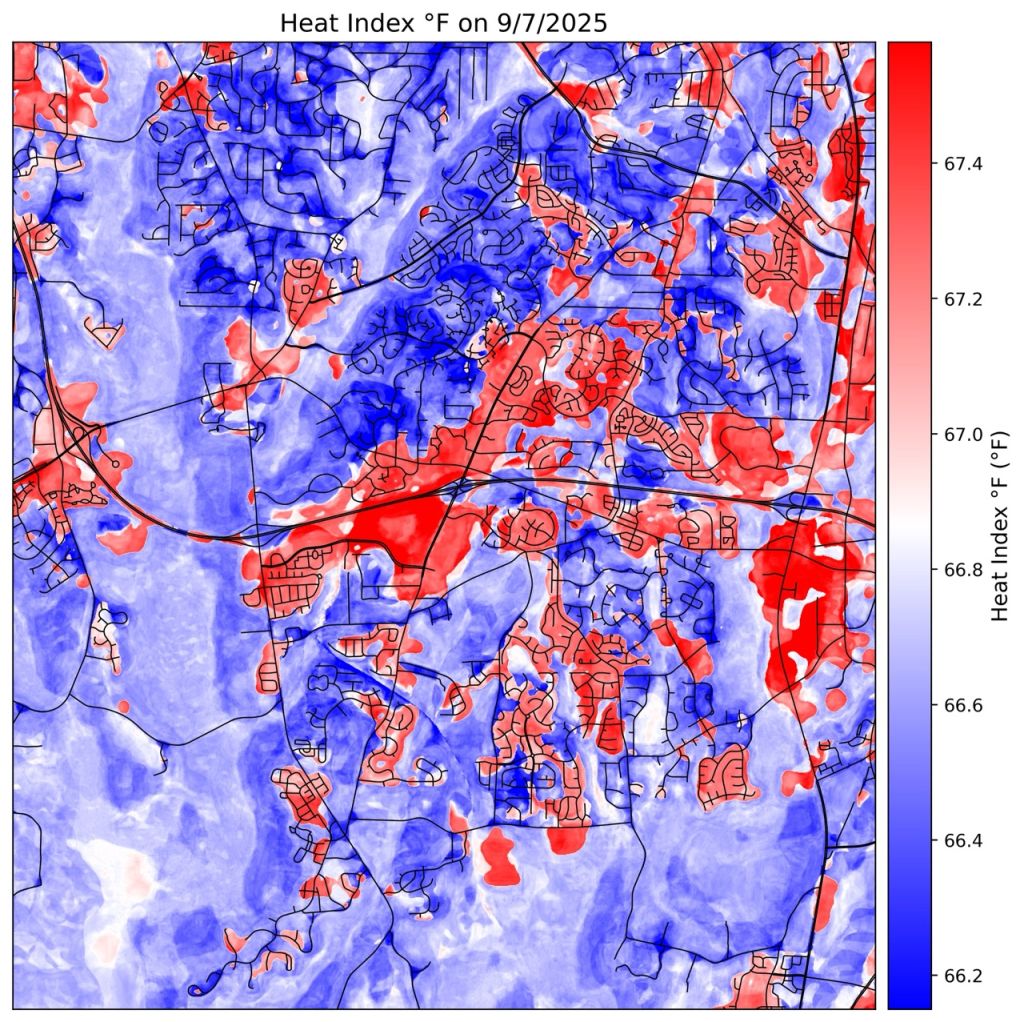
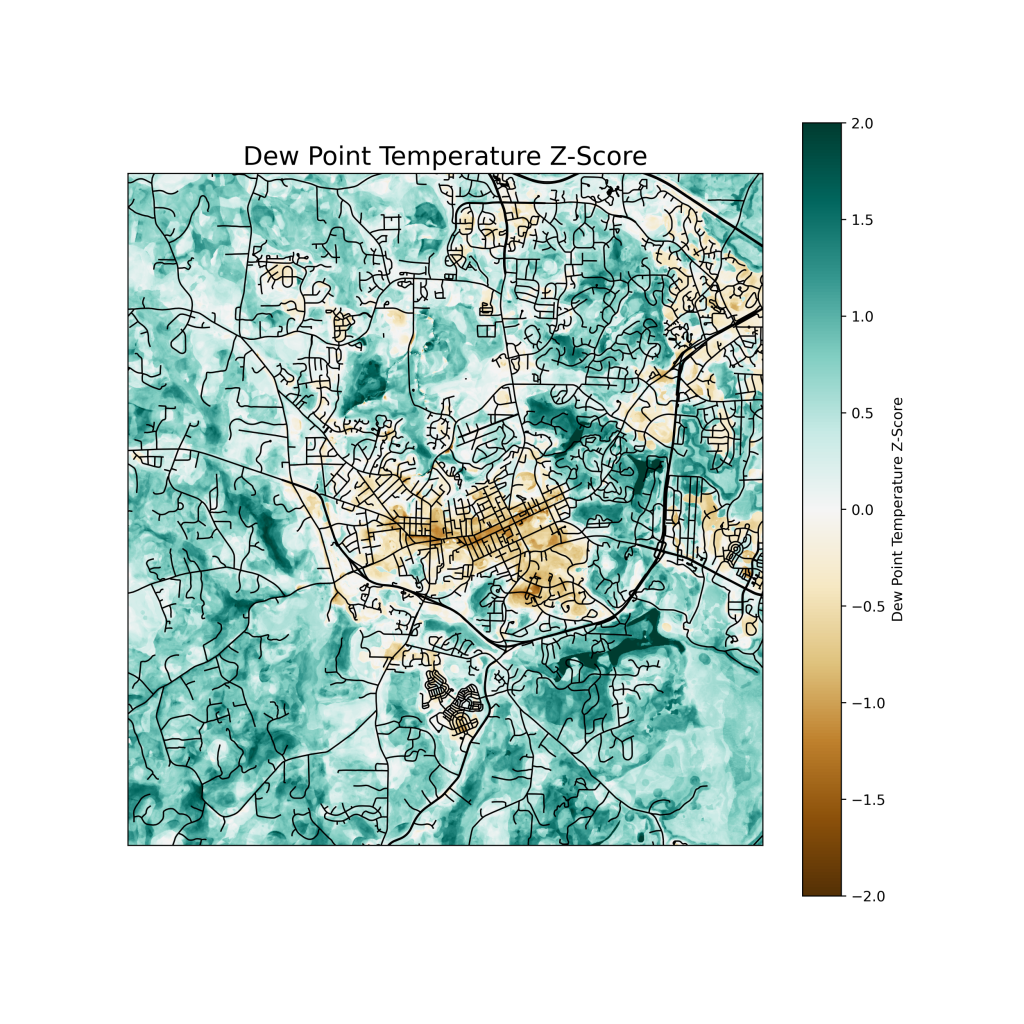
As we collect on-the-ground temperature and humidity data, the research team at SERCC will be incorporating these data into an advanced machine learning (random forest) model. This model will produce detailed heat exposure maps with a resolution of 10 meters (~33 feet), offering greater insight into how heat is distributed across our neighborhoods, parks, schools, streets, greenways, and other public spaces.
This blog will serve as our central hub for sharing progress, publishing the latest maps, and providing updates about the project at least once a week. It’s also a space for engagement. We invite you to comment, ask questions, and follow along as we work together to build more heat-resilient communities.
This past summer, with the help of dozens of dedicated volunteers, we set out to answer a simple but important question: how does extreme heat really vary across our communities?
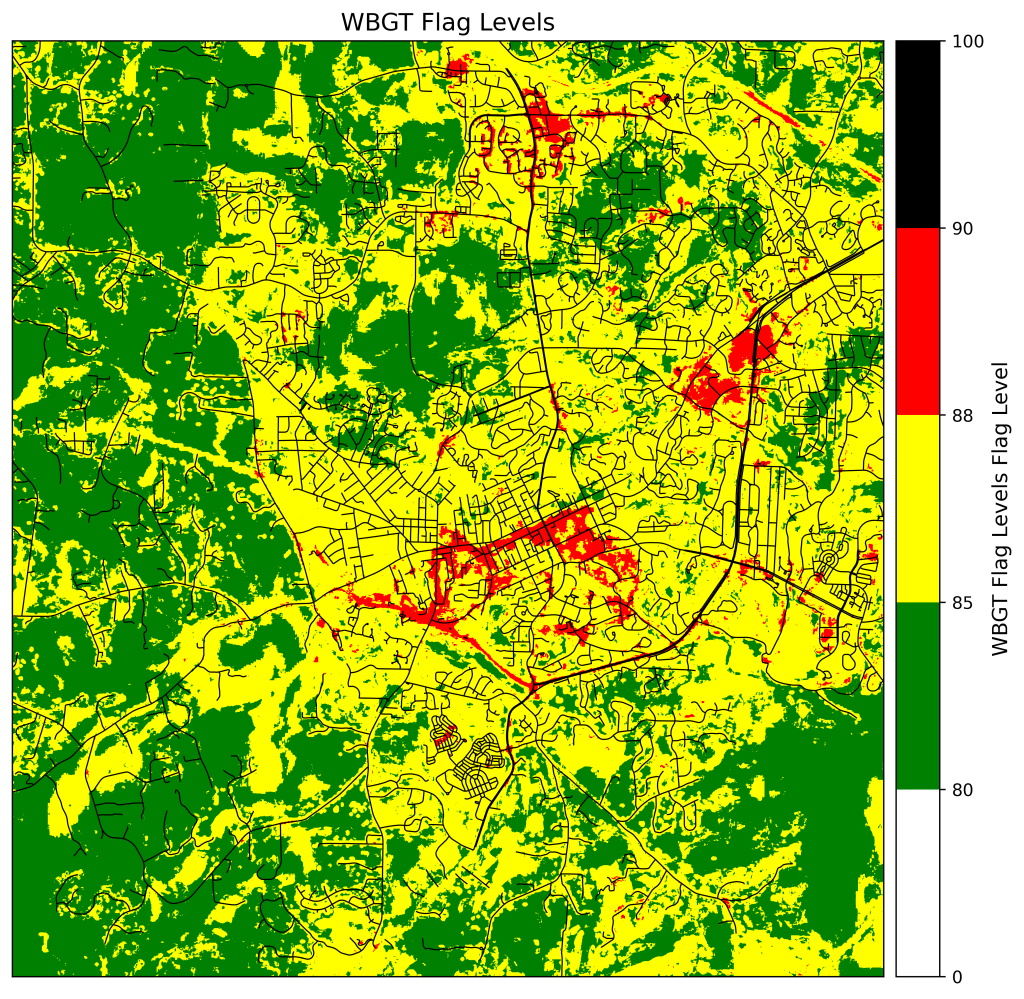
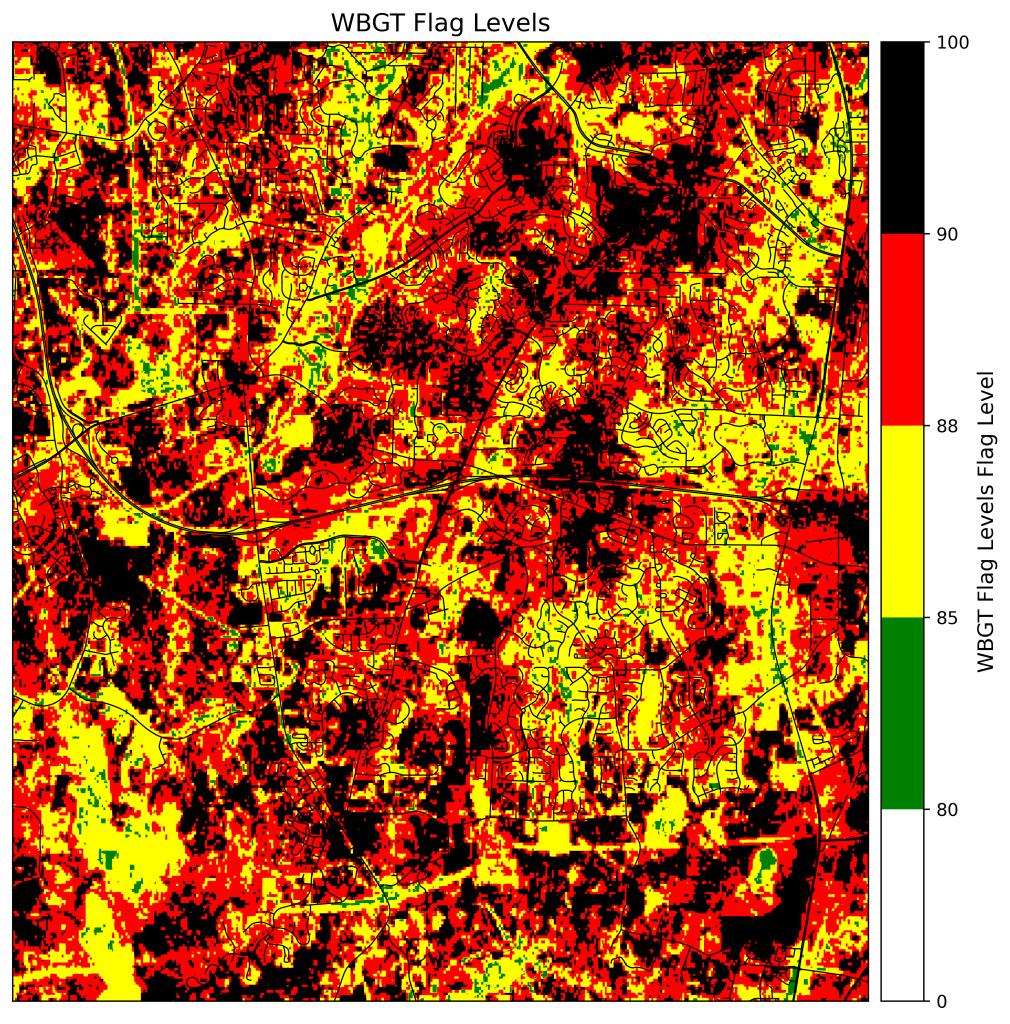
On a summer afternoon, it’s easy to spot the hottest parts of town on a heat map, and schools and playgrounds often glow bright red. During our heat mapping campaign, we found that air temperatures and WBGT values near several schools were noticeably higher than in nearby (mostly shaded) areas.

On a summer afternoon, it’s easy to spot the hottest parts of town on a heat map, and schools and playgrounds often glow bright red. During our heat mapping campaign, we found that air temperatures and WBGT values near several schools were noticeably higher than in nearby (mostly shaded) areas.
Hi everyone, Andrew here! First off, I want to say thank you to all of our amazing citizen-science volunteers. Without you, this work would not be possible. To my knowledge, this is the most extensive mobile transect-based urban heat mapping campaign ever done, and the first time anyone has mapped WBGT in this manner.
Hi everyone, and welcome back to another week of Urban Heat Mapping! We have started to analyze the first couple…
Hello! Welcome back to our heat mapping blog! We have some exciting data to share!! A big thank you to all the volunteers who have helped us collect data!! As we rapidly approach September, the days are getting shorter and the shadows longer, reminding us that fall is right around the corner.
Hi all, and welcome back to the Urban Heat Island Mapping blog! Our busy and full week of collections from the end of July (thanks to you) are processed, and we are excited to bring you some of the insights we found.
Hello all, and welcome to our Urban Heat Island Mapping digital community! We hope this space can provide a platform…