Hello all, and welcome to our Urban Heat Island Mapping digital community! We hope this space can provide a platform for interaction amongst all citizen scientists and SERCC team members. Please feel free to comment below on the findings, your experiences doing data collection, questions, or anything else.
Wow! It has been an amazing summer so far, with 13 days of data collection and more than 50 routes conducted across Orange County and South Durham! Thank you so much to every one of you who has gone out and collected data by walking, biking, or driving.
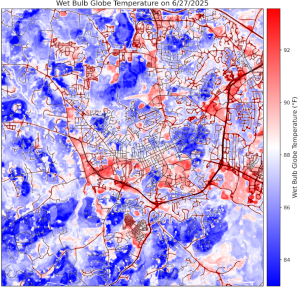
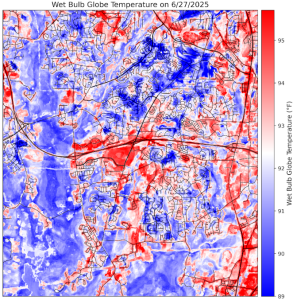
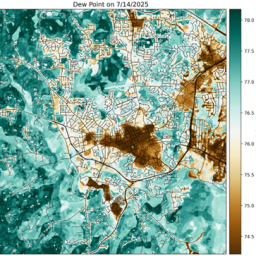
Now that the data has been collected from the field, Andrew has been working diligently to clean the data and create the wet bulb globe temperature model, and I am excited to share some of those maps with you today! For this blog post, I am going to highlight our hottest day of data collection yet, June 27th!
On June 27th, the maximum WBGT value calculated in Durham was 97.4°F, and in Chapel Hill it was 96.1°F. These are both far above the threshold of 90°F for a Black Flag Warning, which calls for an immediate cancellation of outdoor activity and has a heightened risk for heat-related illness.

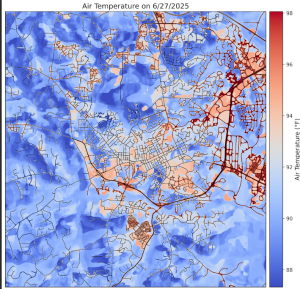
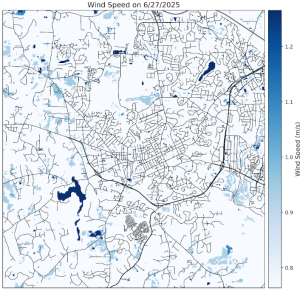
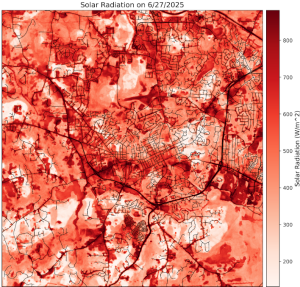
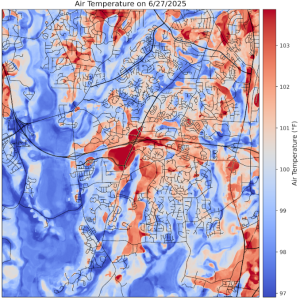
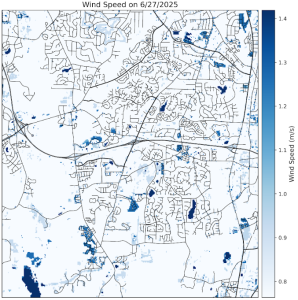
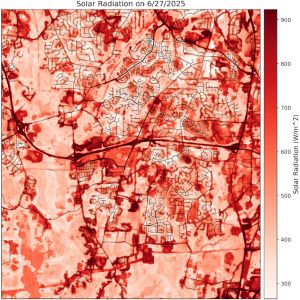
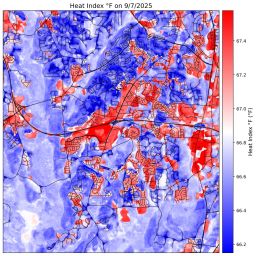
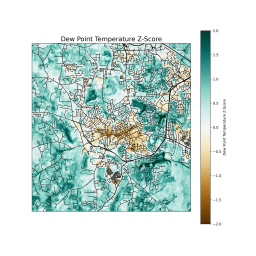
The maps below show the air temperature, solar radiation, and wind speed recorded on June 27th, all factors that contributed to the extreme WBGT values we saw on that day.
Orange County
 |
 |
 |
 |
South Durham
 |
 |
 |
 |
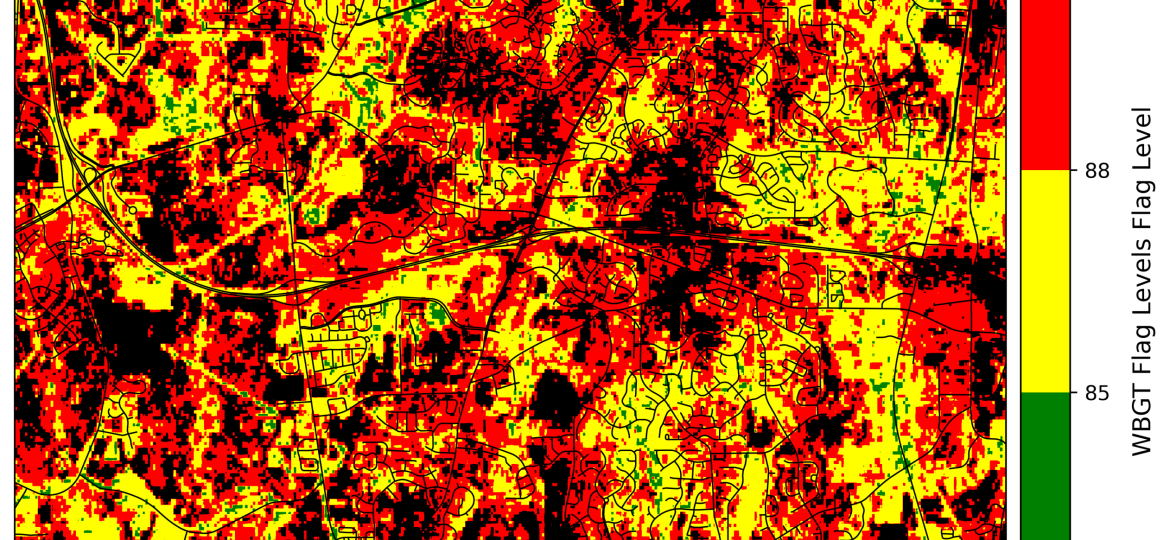
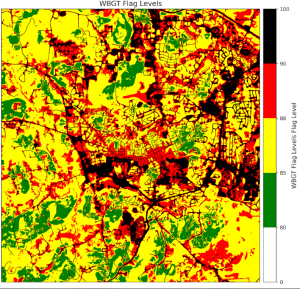
Wet Bulb Globe Temperature Flag Warnings
|
Orange County |
South Durham |
 |
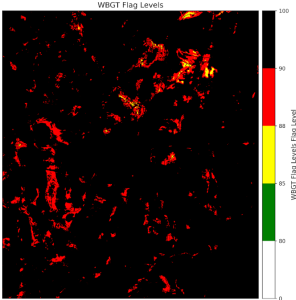 |
These maps show that on June 27th, most of South Durham was experiencing Black Flag conditions, and in Orange County, several areas were in Black or Red Flag conditions. This means a majority of the population across these two areas were in areas that put them at a heightened risk for heat-related illness. These maps can reveal the physical environments that contribute to heat exposure and heat-related illness, but pre-existing medical conditions (COPD, asthma, diabetes, etc.), age, and daily habits can further heighten this risk. Even lower flag warnings can have major health implications for community members.
Is there anything surprising about these maps? Please share your thoughts below!
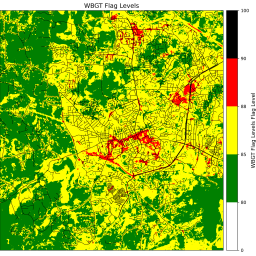
More of a worry than a surprise: if I’m reading the WGBT Flag Levels correctly for Orange County, two of the worst precincts (90+) on/near UNC-CH campus are: 1) Hooker fields and sporting facilities to the south; 2) Union Apartments, Hillsborough St. Even the main quadrangles north and south of Cameron St are in the 88-90 zone. (In contrast, Coker Arboretum is an oasis). In other words, the fanciest apartments and the picture-perfect quadrangles are also some of them most dangerous places to hang out on a hot day. We can be grateful that the 1990’s plans for a mega campus in Carolina North never came to fruition, leaving it as the sanctuary that it is.
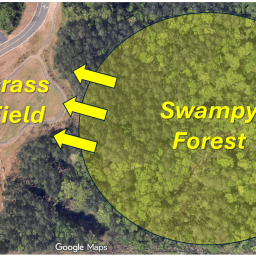
You are reading those levels correctly, and it’s a pattern that we see frequently in some of the hottest days that we’ve recorded so far. Areas like Union Apartments Hillsborough Street and Hooker Fields suffer from a common pattern that increases heat stress and WBGT flag levels!
Essentially, what happens is that these areas have relatively large amounts of green and wooded areas surrounding them, increasing the moisture and humidity in the air from transpiration. This combines with clear-cut areas like quadrangles, apartment buildings, and stadiums where highly reflective pavement exists and buildings are tall enough to block any substantial wind to create an exceptionally hot environment!
The first step towards creating environments and built spaces that are considerate and resilient towards this kind of heat magnification is identifying where it’s likely for people to spend time outside, and prioritizing mitigating heat impacts there.
Happy to hear your insights,
Lauren