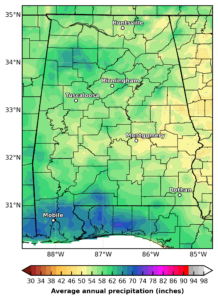
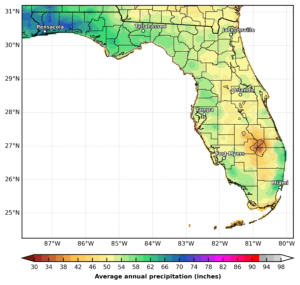
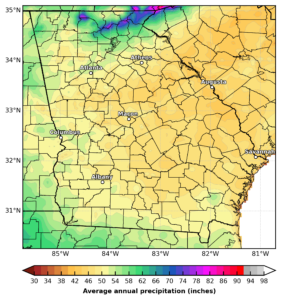
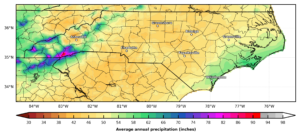
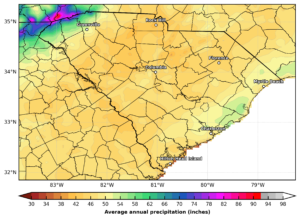
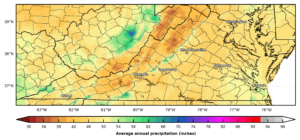
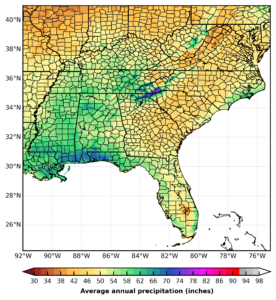
The maps below show the average annual precipitation during 2002–2014 for each state within the southeastern U.S., as well as for the region as a whole. (mouse over each image for a description; click for a larger high-resolution version that can be downloaded). Daily PRISM data supplied by Oregon State University (http://www.prism.oregonstate.edu/) was used to generate each map. A standard 2-inch contour interval is used in all maps, and the colorbar remains fixed for all maps, allowing for direct comparisons to be made across states.
 |
 |
 |
 |
 |
 |
 |