Hi All! With our heat mapping having come to an end, we have been running through months of data and reflecting on particularly interesting days. Throughout this campaign, we didn’t always have crystal clear days with Carolina blue skies; in reality, we did have a few days this season that were rained out. Despite this, there were a few interesting days when the storms had passed shortly before or after our mapping, which allowed us to collect some really interesting and unique data.
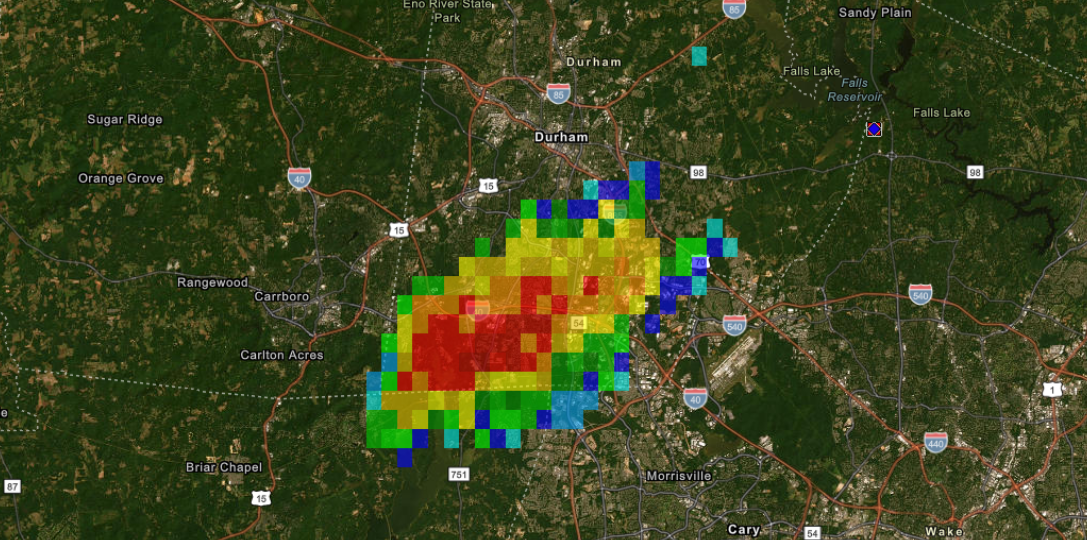
One of these days that was particularly unique was September 25th. Around 1:50, a localized thunderstorm moved directly over Durham and our study area (see Figure 1). Although it was passing close to our start time of 2:15, it moved very quickly across the area and cleared before we started. As a result of this storm, we were able to capture observations during a time when Durham would be incredibly wet and humid and observe how that affects temperatures and WBGT.
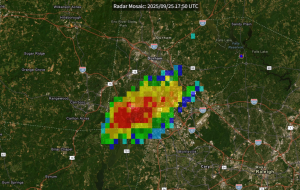
Figure 1. Map of the thunderstorm that passed Durham on September 25th
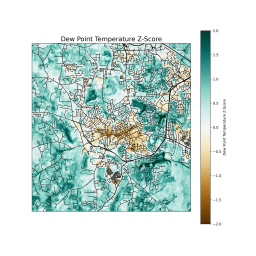
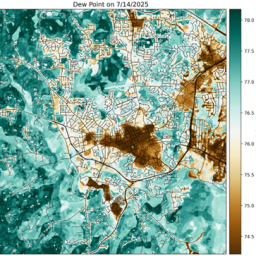
Looking at our dew point temperatures in Figure 2, we found a range from 70 degrees to over 79 degrees. Dew point temperature represents the temperature that the air would need to cool to for saturation to occur. What this means is that high dew points indicate large amounts of water vapor in the air. To better put this into perspective, we can imagine a heat mapping day from a month prior, where the highest dew point values were only around 65 degrees. As expected based on the dew point temperatures, in Figure 3, we also see relative humidity values ranging from around 65% to 93%. This is in comparison to the month prior, where relative humidity values ranged from only about 42% to 51%. Something to note is that having a high dew point value doesn’t necessarily mean there will be a high relative humidity value. If two places had the same dew point temperatures, but different actual temperatures, they would have two different relative humidities. This is seen in the different spatial patterns from our maps. For example, although Southpoint Mall had quite high dew point temperatures, it was also much hotter than the surrounding areas, leading it to actually have a lower relative humidity.
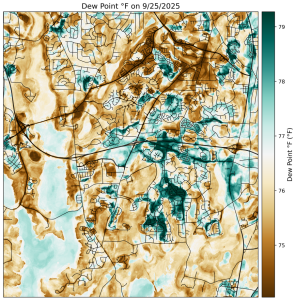
Figure 2. Dew Point Temperatures (°F)
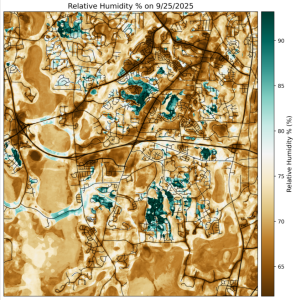
Figure 3. Relative Humidity (%)
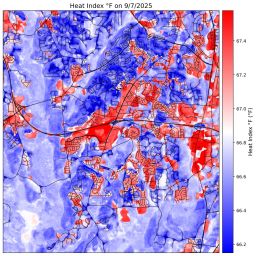
When looking at the actual temperatures shown in Figure 4, we also see that even the coolest areas after the storm are still reaching temperatures of 80 degrees. This follows what Andrew mentioned in a previous blog post regarding heat stress. It’s easy to assume that rain will cool an area down, and in some cases, this can be true. Unfortunately, rain isn’t usually enough to provide relief to an area, and the subsequent humidity can actually make temperatures less bearable.
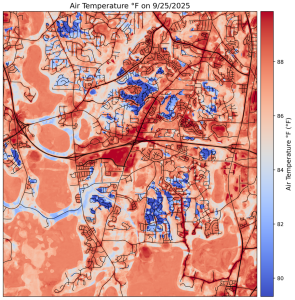
Figure 4. Air Temperature (°F)
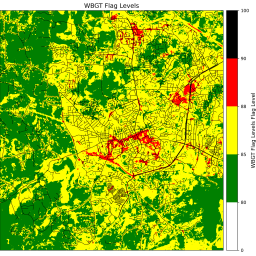
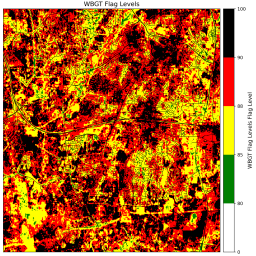
Finally shifting focus to our Wet Bulb Globe Temperatures (WBGT), we can really begin to see the effect that moisture has. Figure 5 shows the different WBGT levels across Durham; these flag levels are used in relation to workouts, practices, or other outdoor physical activity. The first very noticeable thing is that most of the map is within green or yellow flag conditions, especially in urban areas. Green flags indicate generally normal activities with at least 3 breaks per hour, while yellow flag conditions are similar but with slightly longer breaks and include emergency cooling methods at the ready. We can also see that the South Point Mall stands out with high WBGT temperatures, but even more pronounced is the region to the east around Apex Highway. Focusing on this region more, we can see that the dew point is fairly high, and the temperatures also seem to be high, causing the relative humidity to be lower. Additionally, with low tree cover and therefore high solar radiation, this region shows up with black and red flag conditions. Red flag conditions mean that at least one-third of outdoor practice should be designated as rest breaks with a maximum practice length of one hour, and they urge the delay of practice and competitions. Black flag conditions require the cancellation of all outdoor workouts and the delay of any practice or competitions until WBGT decreases. Notably, black flag conditions in a region that is only around 88 degrees is highly unusual and requires high amounts of moisture and solar radiation.
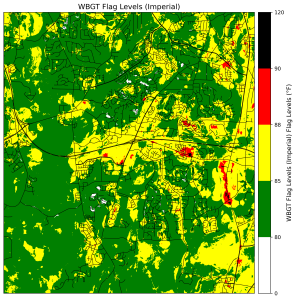
Figure 5. Wet Bulb Globe Temperature Flag Levels (°F)
Overall, these maps do a great job of showing that although rain can be refreshing and cause a brief cooling effect, the impacts can actually be negative. In this case, the high humidity and high temperatures, when combined with urban areas, cause dangerous outdoor conditions that would not be safe for outdoor physical activity. Additionally, due to the localized nature of the clusters of black flag conditions, it is difficult to give accurate warnings and predictions from major weather providers. This is why it is always incredibly important to be aware of the environment you are in and to pay attention to heat stressors, as the temperatures of your city may not be accurate to the temperatures and heat risk of your practice fields. Thank you again to everyone who has helped out through this whole process, whether it was driving with a sensor out your window, walking with one over your shoulder, or riding along with one attached to your bike. We couldn’t have completed this work alone. Please don’t hesitate to leave any comments or questions.