Hi everyone, Andrew here! First off, I want to say thank you to all of our amazing citizen-science volunteers. Without you, this work would not be possible. To my knowledge, this is the most extensive mobile transect-based urban heat mapping campaign ever done, and the first time anyone has mapped WBGT in this manner.
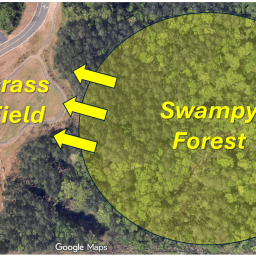
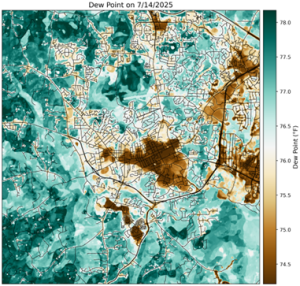
Today, I want to write about the impact of humidity on WBGT and urban heat stress. The urban heat island is formed by the removal of natural features, such as trees and vegetation, and replacing them with surfaces such as concrete, steel, and asphalt. When the sun shines on these surfaces, they heat up more than a natural surface would (think about walking on your blacktop driveway barefoot compared to grass). These surfaces then, in turn, emit energy upward, heating the lower atmosphere. Additionally, removing vegetation and replacing it with urban development also forms what is referred to as the Urban Dry Island (UDI). Vegetation releases water vapor into the atmosphere through transpiration, making the air more humid; since urban areas have less vegetation, they are generally less humid than surrounding rural areas (see Figure 1 below).
The UDI effect lowers the heat stress somewhat in highly developed areas. When the humidity is lower, sweat is able to evaporate and cool the human body, lowering the overall heat stress.
When it comes to heat stress, most of the time, this lack of water vapor is not enough to mitigate the effects of the increased temperature, and the urban area will have a higher WBGT. However, sometimes this is not the case. On 6 July 2025, a tropical system, Chantal, dropped over 9 inches of rain on Carrboro and Chapel Hill, with some surrounding areas receiving up to 12 inches of precipitation. Some areas surpassed the 1000-year event precipitation threshold. It continued to be hot and humid for some time after this, with multiple afternoon thunderstorms over the following days. There was widespread flooding throughout much of the area. We gathered heat, humidity, and solar radiation data the day after the flooding to assess heat stress. So, what did we find?
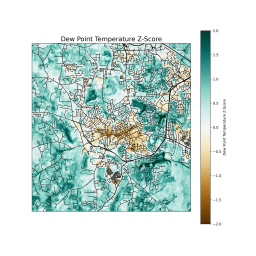
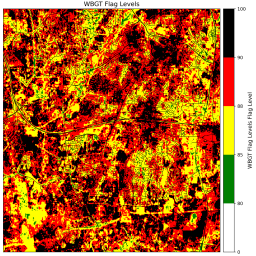
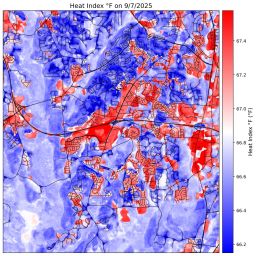
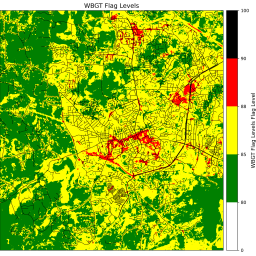
The humidity was anomalously high, as expected after such an event, but the urban dry island was also very pronounced, with more than 4°F of dew point difference between the downtown area and the more rural, less developed surrounding areas (see Figure 1). It is hypothesized that this is due to the local geography of Chapel Hill. The downtown area is built high on the hill and has a high percentage of impervious surfaces. All of this stormwater from Chantal landed and ran off quickly from the downtown area, flooding much of the surrounding low-lying area. This water sat in the areas surrounding downtown and supplied the moisture necessary for extremely high dew point temperatures. This difference in dew point was enough to actually make the WBGT in the areas surrounding the downtown area higher than in the actual downtown area, despite the air temperature still being hotter downtown (see Figure 2 below)!
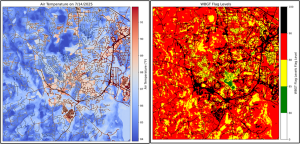
While the air temperature is almost always higher in the downtown area, we had hypothesized that in some conditions, the heat stress may be higher in more rural areas. The extreme urban dry island observed on 14 July proves that sometimes a combination of local geography and antecedent conditions can lead to a WBGT urban cool island, despite the air temperature still being higher than undeveloped areas.
While we have already made many interesting observations, this is one of my favorites so far. Over the coming months, I expect there will be many more scientific findings as we comb through the over 40 days of data we have from this heat season. We are planning an engagement event next month at the Chapel Hill Public Library to discuss learnings from this work and thank our citizen science volunteers. More information will be shared soon over email, and we would love to see you there!