Hello! Welcome back to our heat mapping blog! We have some exciting data to share!! A big thank you to all the volunteers who have helped us collect data!! As we rapidly approach September, the days are getting shorter and the shadows longer, reminding us that fall is right around the corner. In fact, meteorological fall starts September 1 and ends November 30. The forecast for this week is showing highs in the 70’s and lows in the 50’s! As those of us who have lived in this area of North Carolina long enough know, it probably won’t last!
Speaking of cooler weather, August has been cooler during the day including two days (August 6th and 7th) only reaching daytime highs of 69 and 70 degrees, respectively, at Chapel Hill! This month has also seen a lot of rain. The only day this month above 90 degrees was August 1st. From August 3rd through the 10th, a relatively infrequent weather pattern for early August emerged as a wedge of cool high pressure nosed in from the northeast with a rich humid tropical air mass lifting over it. In the colder months, this is what is usually termed cold air damning as cooler, denser air is trapped between the Appalachian Mountains to the west and the warm waters of the Gulf Stream off the coast to the east. Visit the SERCC website to find out more about the interesting perspectives on this month.
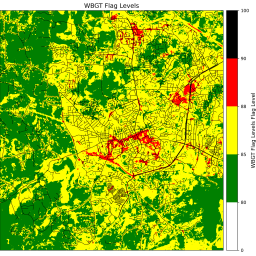
Let’s dive into an example that illustrates how high dew points can play a factor in Wet Bulb Globe Temperature readings for two very different days temperature wise.
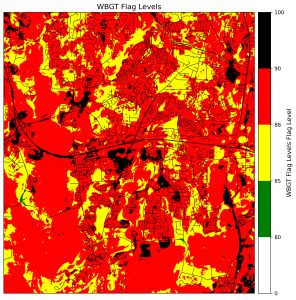
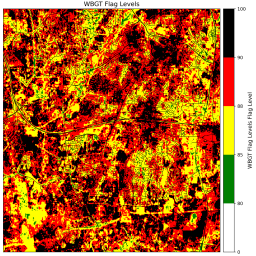
As you can see from the image on the left, July 20 was a very dangerous day heat wise. There are scattered black flagged areas (where practice for school organized sports would be suspended) and large swaths of red flagged areas (where no pads/extra wearable equipment and 5 minute rest and water breaks would be required every 15 minutes). Extreme heat means taking extreme precautions. Whether working at a construction site, mowing the lawn, or going for a run, individuals should consider exercising indoors, canceling the activity/job, or modifying their work schedule to avoid the hottest part of the day. Even conditioned athletes can succumb to heat illness or death without the proper precautions. Due to the extreme stress this type of heat causes on the human body, it is highly advisable for the elderly, young children, and those with health conditions to stay indoors. It is no surprise that the high temperature on July 20th was 94 degrees and the dew point at that time was 74 degrees at RDU. A very hot AND humid air mass!
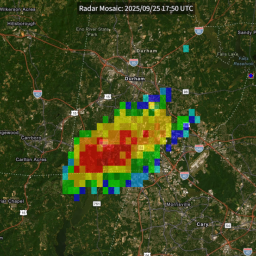
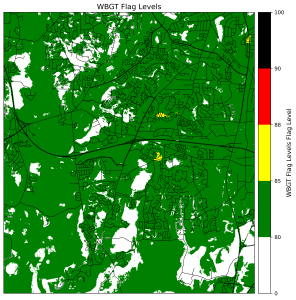
Looking at August 11th, conditions are much less oppressive; some areas did not reach flagged conditions, though there was a large swath of green flagged conditions (normal practice with 5 minute rest and water breaks every 20 minutes) and even a few small areas of yellow flagged conditions (5 minute rest and water breaks every 20 minutes). On this day, the high temperature was only 82 degrees at RDU, but the dew point at that time was 75 degrees! There was also extensive cloud cover at the time we started our mapping routes at 2:15. We actually got rained on (a first!!) two-thirds through the walking route by a renegade shower that was ahead of the main line of showers and thunderstorms that eventually overspread the area around 5pm. The primary reason there was any WBGT flagged areas was the high dew point that corresponded with relative humidity values in the 90% range. The advection of soupy tropical air from the surrounding tropical-like waters off the coast into our area can be problematic in terms of the body’s ability to evaporate sweat and cool itself. This example shows how the dew point temperature (humidity) can impact the Wet Bulb Globe Temperature, as both days had dew points in the mid 70’s.
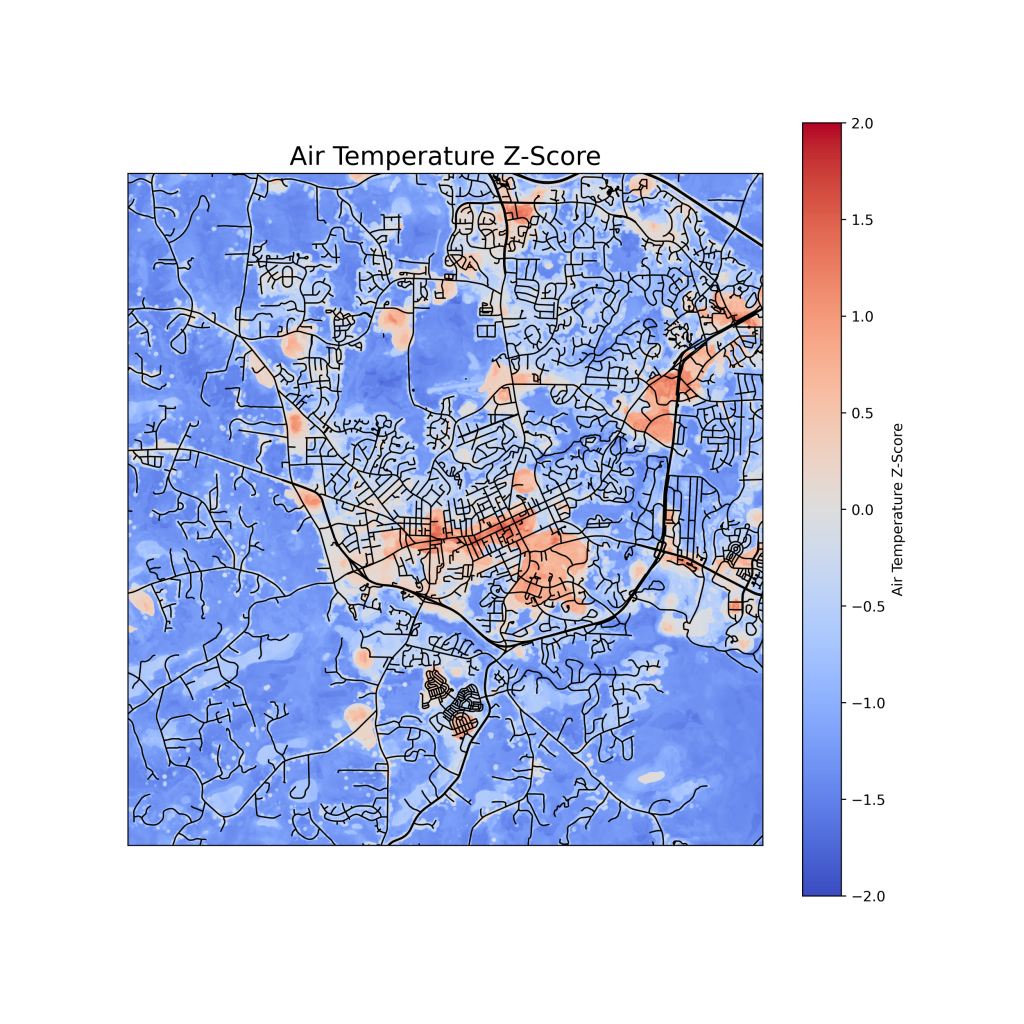
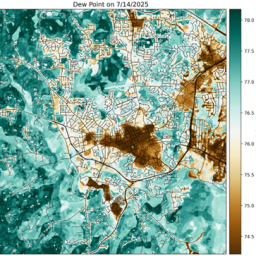
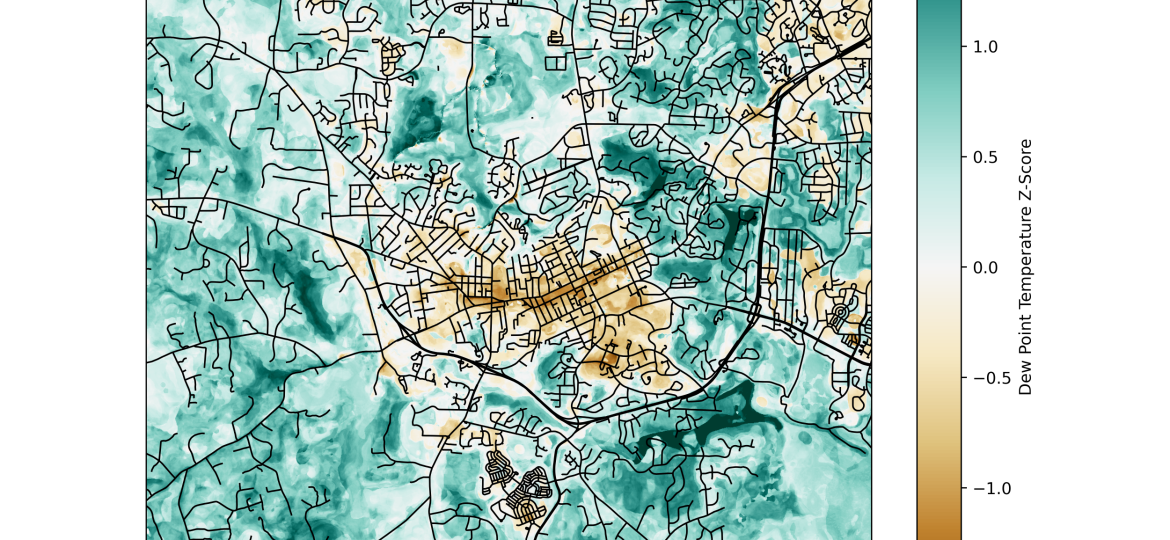
As Andrew Robinson continues his wizardry in feeding data into his machine learning model, he has generated some interesting findings with the maps seen below. This includes all the field data collected in Orange County since we started in mid-June. A Z-score is a measure how far a value (air temperature in this case) in a pixel of data is from the mean (average) measured in standard deviations. The higher (or lower) the value, the further away a pixel shown on a map is away from the expected mean of the data set. A Z-score near zero means that value is close to the average.
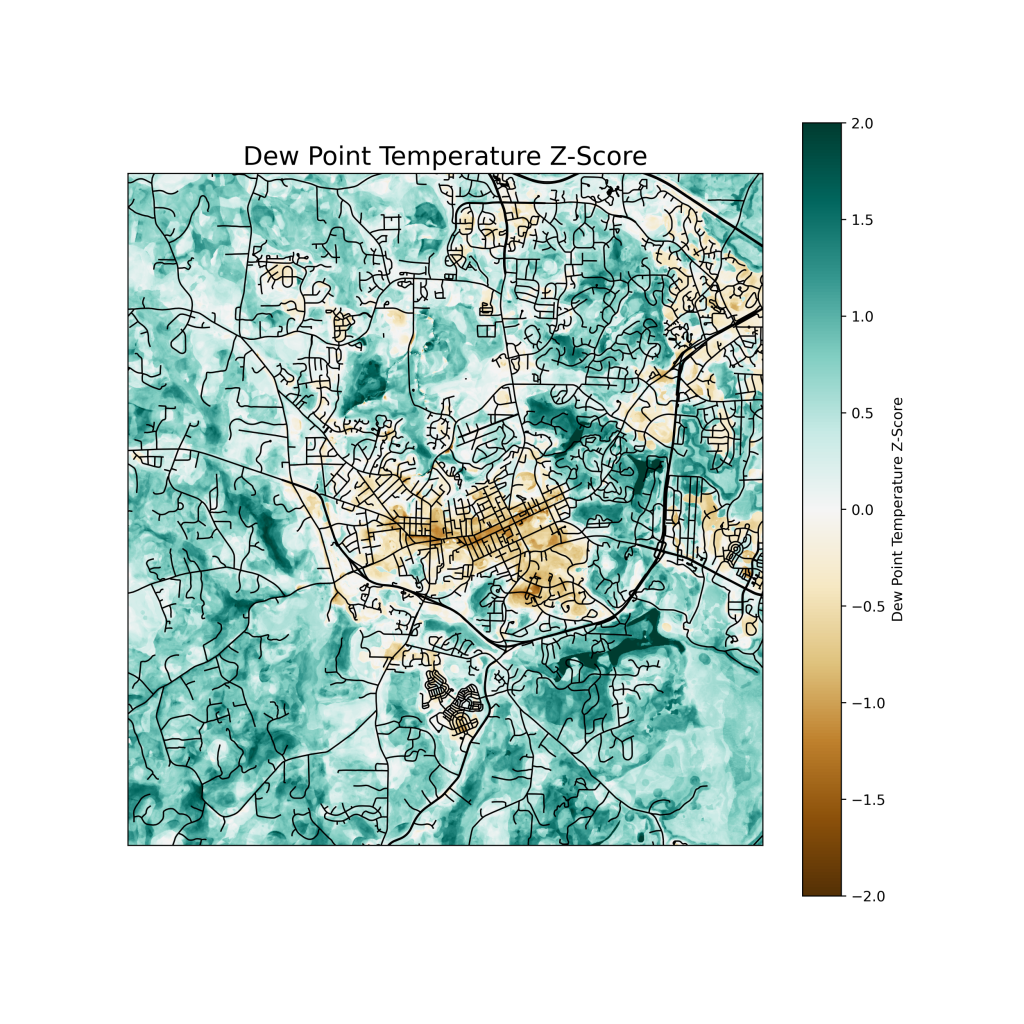
Looking at the air temperature Z-scores, the Franklin St. business district, along with the university area, hospital complex, as well as Eastgate shopping center stand out as having air temperatures above average. The areas adjacent to Eastgate also stand out as having higher dew point temperatures due to the watershed receiving excessive rainfall. It would make sense that large areas with impervious surfaces would be warmer. It has, until recently, been an above average summer in regard to temperature, but we have also had a lot of rain! From June 1st through August 23rd, Chapel Hill has received 26.4 inches of rain! That is the wettest period on record that goes back 135 years! Looking at the adjacent greener landscape, the temperature Z-scores are negative, meaning they fall below the mean. On the other hand, the dew point Z-scores follow an inverse pattern, i.e., lower dew point temperature Z-scores are found in the impervious areas and higher dew point temperature Z-scores are found in the surrounding greener areas. How can it be both warmer/less humid and cooler/more humid in areas that are in such close proximity to each other? Andrew refers to this phenomenon as the “urban heat dry island”. (I suspect there will be more on this in an upcoming post). UNC and downtown Chapel Hill sit on top of an inverted bowl, which causes all the rainfall to drain off into streams, creeks, backyards, and forested areas surrounding downtown. The result is heavy rain that falls on impervious surfaces evaporates quickly when there is fast run off.
In the atmospheric science world, these are examples of the sensible heat flux and the latent (meaning hidden) flux. In plain terms, the sensible heat flux is the heat you feel coming off a dry sidewalk or parking lot on a warm summer day. This is reflected in the positive temperature Z-score in urban environments. In contrast, the latent heat flux is when the sun’s energy is used to evaporate water from the landscape instead of heating the ground. Evaporation cools the surrounding air by taking heat from the environment and storing it in the water vapor. When the water vapor condenses into clouds and eventually precipitation, it releases this stored heat back into the atmosphere and warms the air. It is all part of the heat budget and water cycle played out in your own backyard. There can be a downside in the summer months. The dew point Z-scores are higher in the wetter “green” spaces as the air gets loaded with water vapor, and lower in the urban areas where there is little water to evaporate. As we have seen after the heavy rains from Tropical Storm Chantal, all that water vapor from evaporation caused dew points to climb to 80 degrees (or near it) during the afternoon hours on multiple days. Combined with air temperatures in the mid 90’s, this made July a very uncomfortable month and resulted in high WBGT readings.