Hi all, and welcome back to the Urban Heat Island Mapping blog! Our busy and full week of collections from the end of July (thanks to you) are processed, and we are excited to bring you some of the insights we found.
Between July 26 and August 1, 2025, Chapel Hill and Durham experienced a period of extreme heat. High temperatures reached into the mid- to the mid 90s each day, while overnight lows remained slightly elevated in the low to mid-70s. These temperatures were above normal for late July, and they followed a record-setting month across the region. Raleigh-Durham recorded its hottest July on record at RDU, with more interesting climatological insights available on the SERCC website! These conditions allowed sunlight to heat surfaces quickly and kept heat from escaping overnight, especially in areas with impermeable ground.
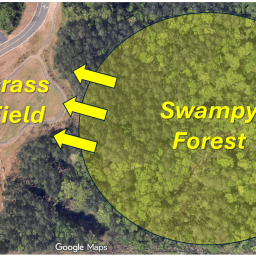
This stretch of heat came just a few weeks after Tropical Storm Chantal brought heavy rainfall and flooding to the region in early July. Together, these events show how summer in our area can be variant over time. The final week of July was dry and hot, with conditions that pushed Wet Bulb Globe Temperature (WBGT) readings into high levels in some outdoor spaces, including parts of the Chapel Hill campus. This highlights the human-centric applications of monitoring fine-scale heat conditions, since risk can vary greatly within these small areas depending on land cover, shade, and surface materials.
As back to school season approaches for Chapel Hill, let’s take a look at the impact of extreme heat on outdoor life.
On to some of our interesting results from July 28th!
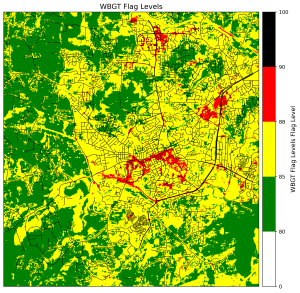
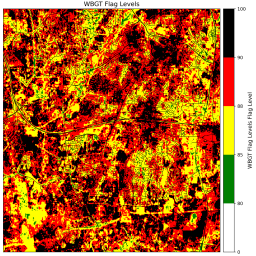
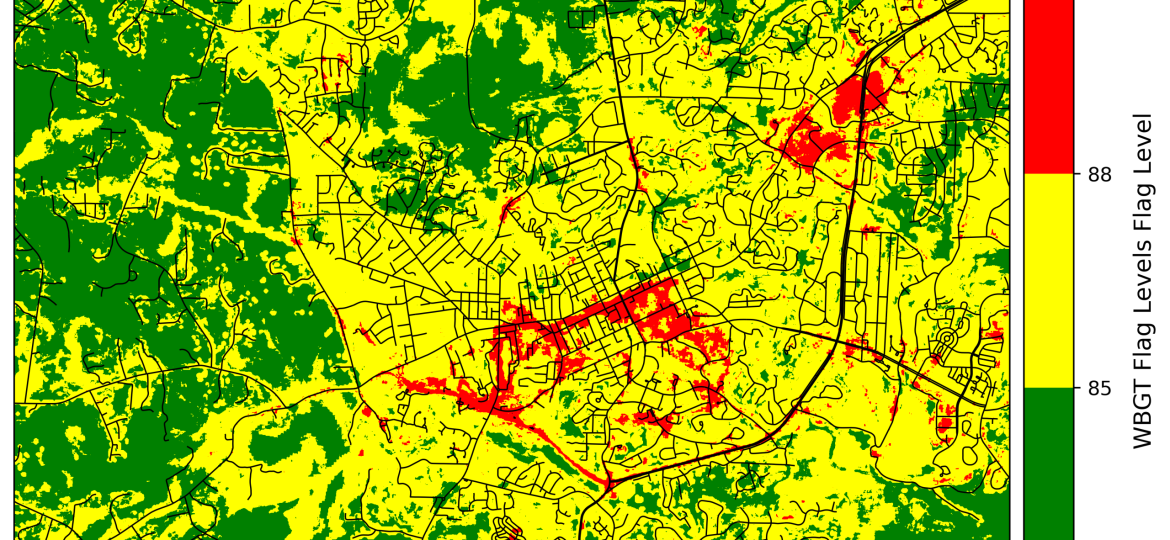
The above map shows our modeled WBGT flag levels on July 28th. The graphic above models that the maximum WBGT flag level attained during our data collection time was a Red Flag level, and despite not entering Black Flag territory, Red Flag levels can be incredibly straining to the human body. Standardized guidance for outdoor exercise is to “schedule frequent mandatory rest/water breaks” at a pace of 5 minutes of rest/water breaks every 15 minutes.
Another notable area picked up in a concentrated pattern of highest flag level is the Eastgate Crossing area here, which routinely sees some of the highest WBGT flag levels in Orange County. This area is almost entirely covered in impermeable pavement, and the concentration of businesses in that area increases the amount of parking lot needed to facilitate the retail area. This combination of conditions can make sensible heat stress incredibly high when combined with the intersections of Bolin and Booker Creeks in the area.
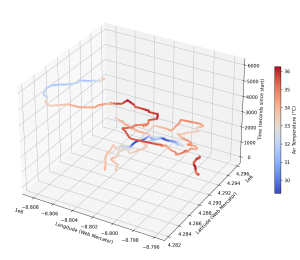
This 3D cube called a space-time cube, and measures longitude and latitude (location) on the X and Y axes, with time on the Z axis measured in seconds since start of route. You can see the start and end times of our driving biking and walking routes intersecting with each other, which provides an interesting and layered station for the process of citizen science data collection! The air temperature measured by our HOBO loggers is shown in degrees Celsius on the scale to the right of the graphic, and these routes overlay with each other here in a unique data format.
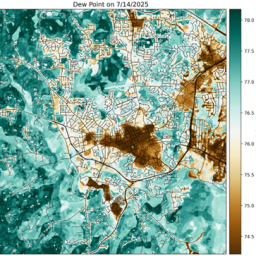
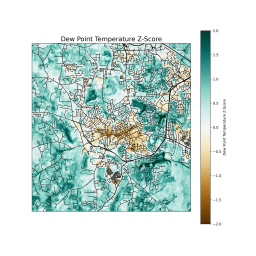
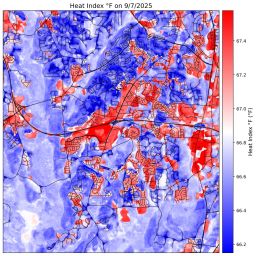
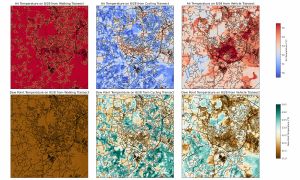
Below are the measures utilized to calculate WBGT for this day that enter our downscaling model!
I hope that this data was interesting and helped further your understanding of the local patterns of extreme heat in our area, and we look forward to bringing you more data and insights from this project as we go along! Local knowledge is incredibly helpful to us as we go through this research, so please let us know in the comments if you think of anything that you’d like to add to our discussion, or have any questions, comments, or insights for us!