A Night of Sharing, Learning, and Looking Ahead: Highlights from Our Heat Mapping Community Event
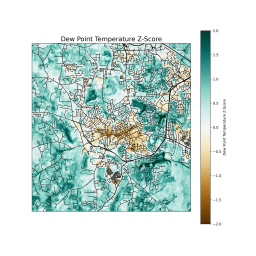
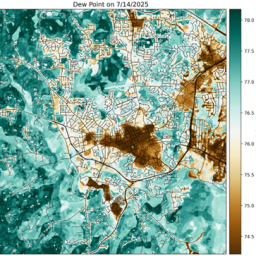
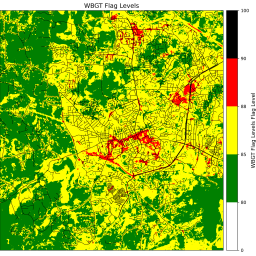
This past summer, with the help of dozens of dedicated volunteers, we set out to answer a simple but important question: how does extreme heat really vary across our communities? Together, we collected more than one million measurements across Chapel Hill, Carrboro, and South Durham, by car, bike, and on foot. The result was one of the most detailed heat datasets of its kind, focused on Wet Bulb Globe Temperature (WBGT), a measure that better captures how hot it actually feels to the human body by accounting for sun, wind, and humidity.
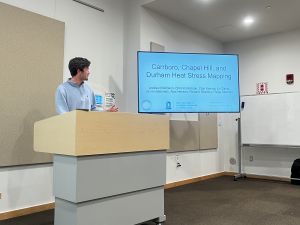
On November 10, 2025, we brought that work back to the community with a public engagement event at the Chapel Hill Public Library. The goal was to share what we learned, hear from local experts and residents, and start a conversation about how the data can support more heat-resilient communities.
When most of us hear “it’s hot today,” we think about air temperature or the heat index. But those don’t tell the full story, especially if you’re working outside, waiting at a bus stop, walking or biking to school, playing sports, or spending long hours in the sun. WBGT adds key pieces of the puzzle, including sunlight and wind, to better represent heat stress on the body. That means it can reveal hot spots that traditional maps often miss. And that’s exactly what we found. Some of the highest risk areas weren’t always in the places people expect. In fact, some areas showed up outside the urban core, near newer developments, and in places where shade, surface materials, and land use combine to make conditions particularly oppressive. In other words, heat risk is local, sometimes down to the scale of a single block or intersection.
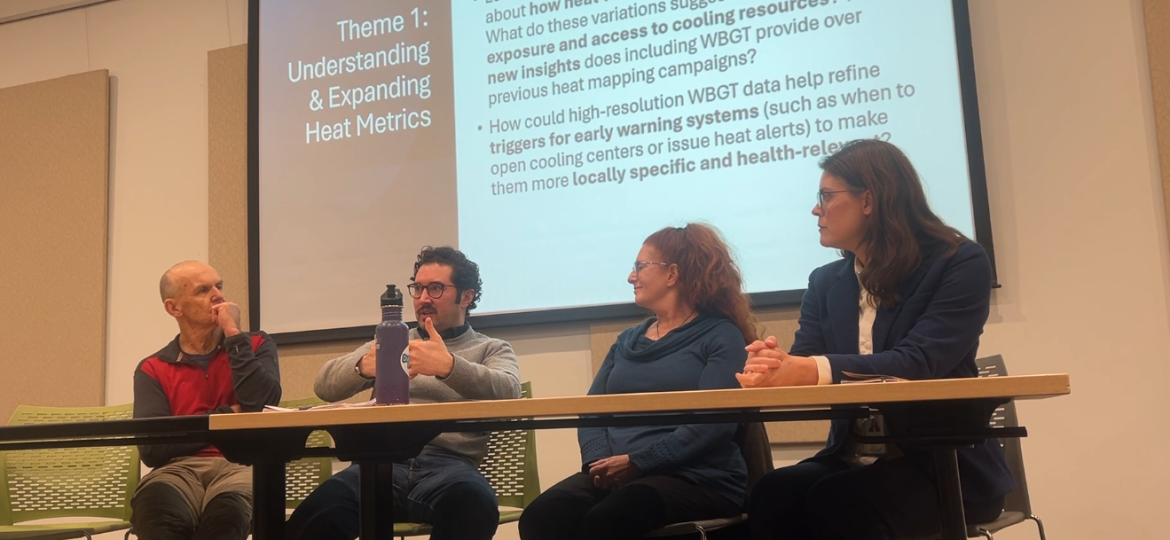
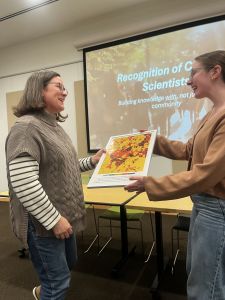
Our community event brought together more than 20 participants from across the region, including local and county government, public health, sustainability offices, community organizations, and the citizen scientists who helped collect the data. The evening included a thank-you and recognition for our volunteers, a presentation on what the heat mapping revealed, and a panel discussion focused on what this all means for real-world decisions.
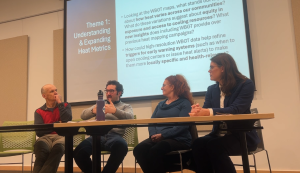
Our panelists included (from left to right in the figure below): Gary Slade (citizen scientist), Nikhil Kothegal (climate and health program lead, NC Department of Health and Human Services), Tobin Freid (sustainability manager, Durham County), and Amy Armbruster (chief sustainability officer, Town of Carrboro). Joey Williams, manager for CAPA Strategies/NOAA Heat Watch, joined over Zoom.
The conversation centered on four main ideas:
Better ways to measure heat: WBGT helps capture risks that most other metrics miss, but it also needs to be explained clearly so it’s useful to everyone, not just scientists.
The importance of scale: While we can’t issue heat alerts for every block, hyper-local data is incredibly valuable for things such as tree planting and shade projects, safer schoolyards and playgrounds, protecting outdoor workers, and improving bus stops, sidewalks, and public spaces.
Communication matters: Data alone doesn’t keep people safe. Panelists emphasized the importance of simple visuals and clear, plain-language messaging, along with outreach that meets people where they are. Just as importantly, they stressed that risk communication should clearly connect where it’s hottest with what that means for people’s health.
From awareness to action: The big question isn’t just where it is the hottest, but where are people spending time, who is most exposed, and where can changes make the biggest difference? This is where heat mapping can support smarter planning, better landscape designs, and more targeted investments, from trees and shade structures to cooling centers and work-rest guidelines.
One of the most interesting parts of the discussion was how this data could shape future decisions, including land-use and development planning, designing cooler, safer neighborhoods, protecting infrastructure and essential services, improving worker safety and public health guidance, and even testing “what-if” scenarios, like what happens if we remove trees, or add more pavement, or change building layouts. In the end, the overarching message from the panel and audience is that this kind of detailed, community-centered data can help turn heat from an invisible risk into something we can plan for and reduce.
So, what’s next? We’re already planning the next phase of this work, including more heat mapping campaigns, more community engagement events, and new web-based tools to help turn this data into action. We’ll be sharing more details in the coming months, so stay tuned!